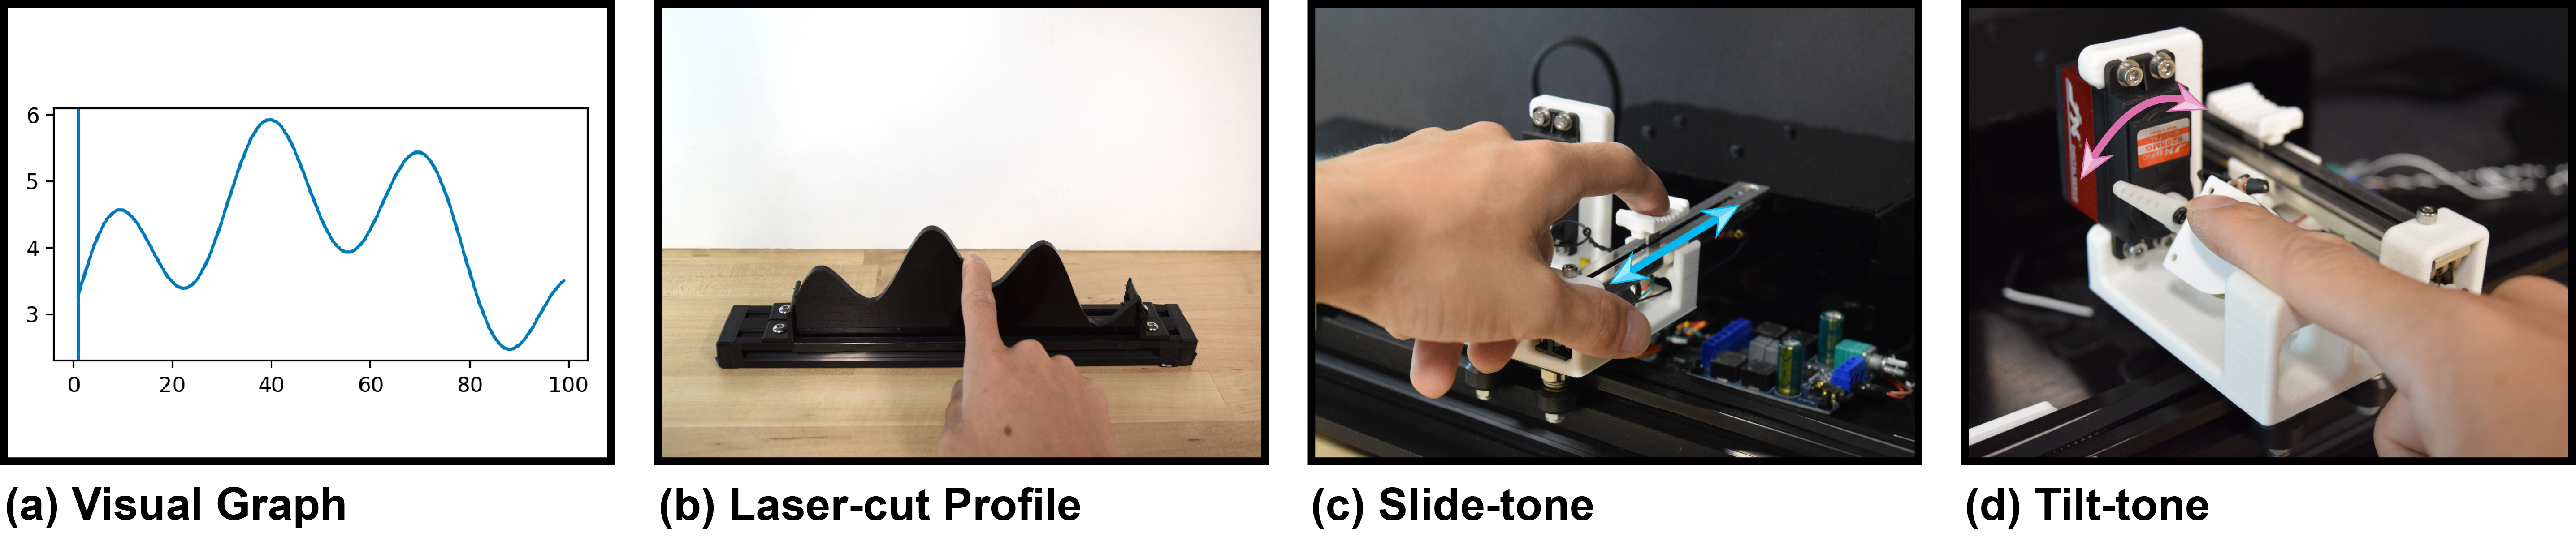
Informed by formative workshops that explored how haptic cues for fingerpad position and inclination support shape perception of data graphs (a-b), we introduce two refreshable, 1-DOF audio-haptic interfaces for data exploration. Slide-tone (c) relies on finger position with sonification, and Tilt-tone (d) relies on fingerpad contact inclination with sonification to provide shape feedback to users.
Abstract
We increasingly rely on up-to-date, data-driven graphs to under-stand our environments and make informed decisions. However, many of the methods blind and visually impaired users (BVI) rely on to access data-driven information do not convey important shape-characteristics of graphs, are not refreshable, or are prohibitively expensive. To address these limitations, we introduce two refreshable, 1-DOF audio-haptic interfaces based on haptic cues fundamental to object shape perception. Slide-tone uses finger position with sonification, and Tilt-tone uses fingerpad contact inclination with sonification to provide shape feedback to users. Through formative design workshops (n = 3) and controlled evaluations (n = 8), we found that BVI participants appreciated the additional shape information, versatility, and reinforced understanding these interfaces provide; and that task accuracy was comparable to using interactive tactile graphics or sonification alone. Our research offers insight into the benefts, limitations, and considerations for adopting these haptic cues into a data visualization context.
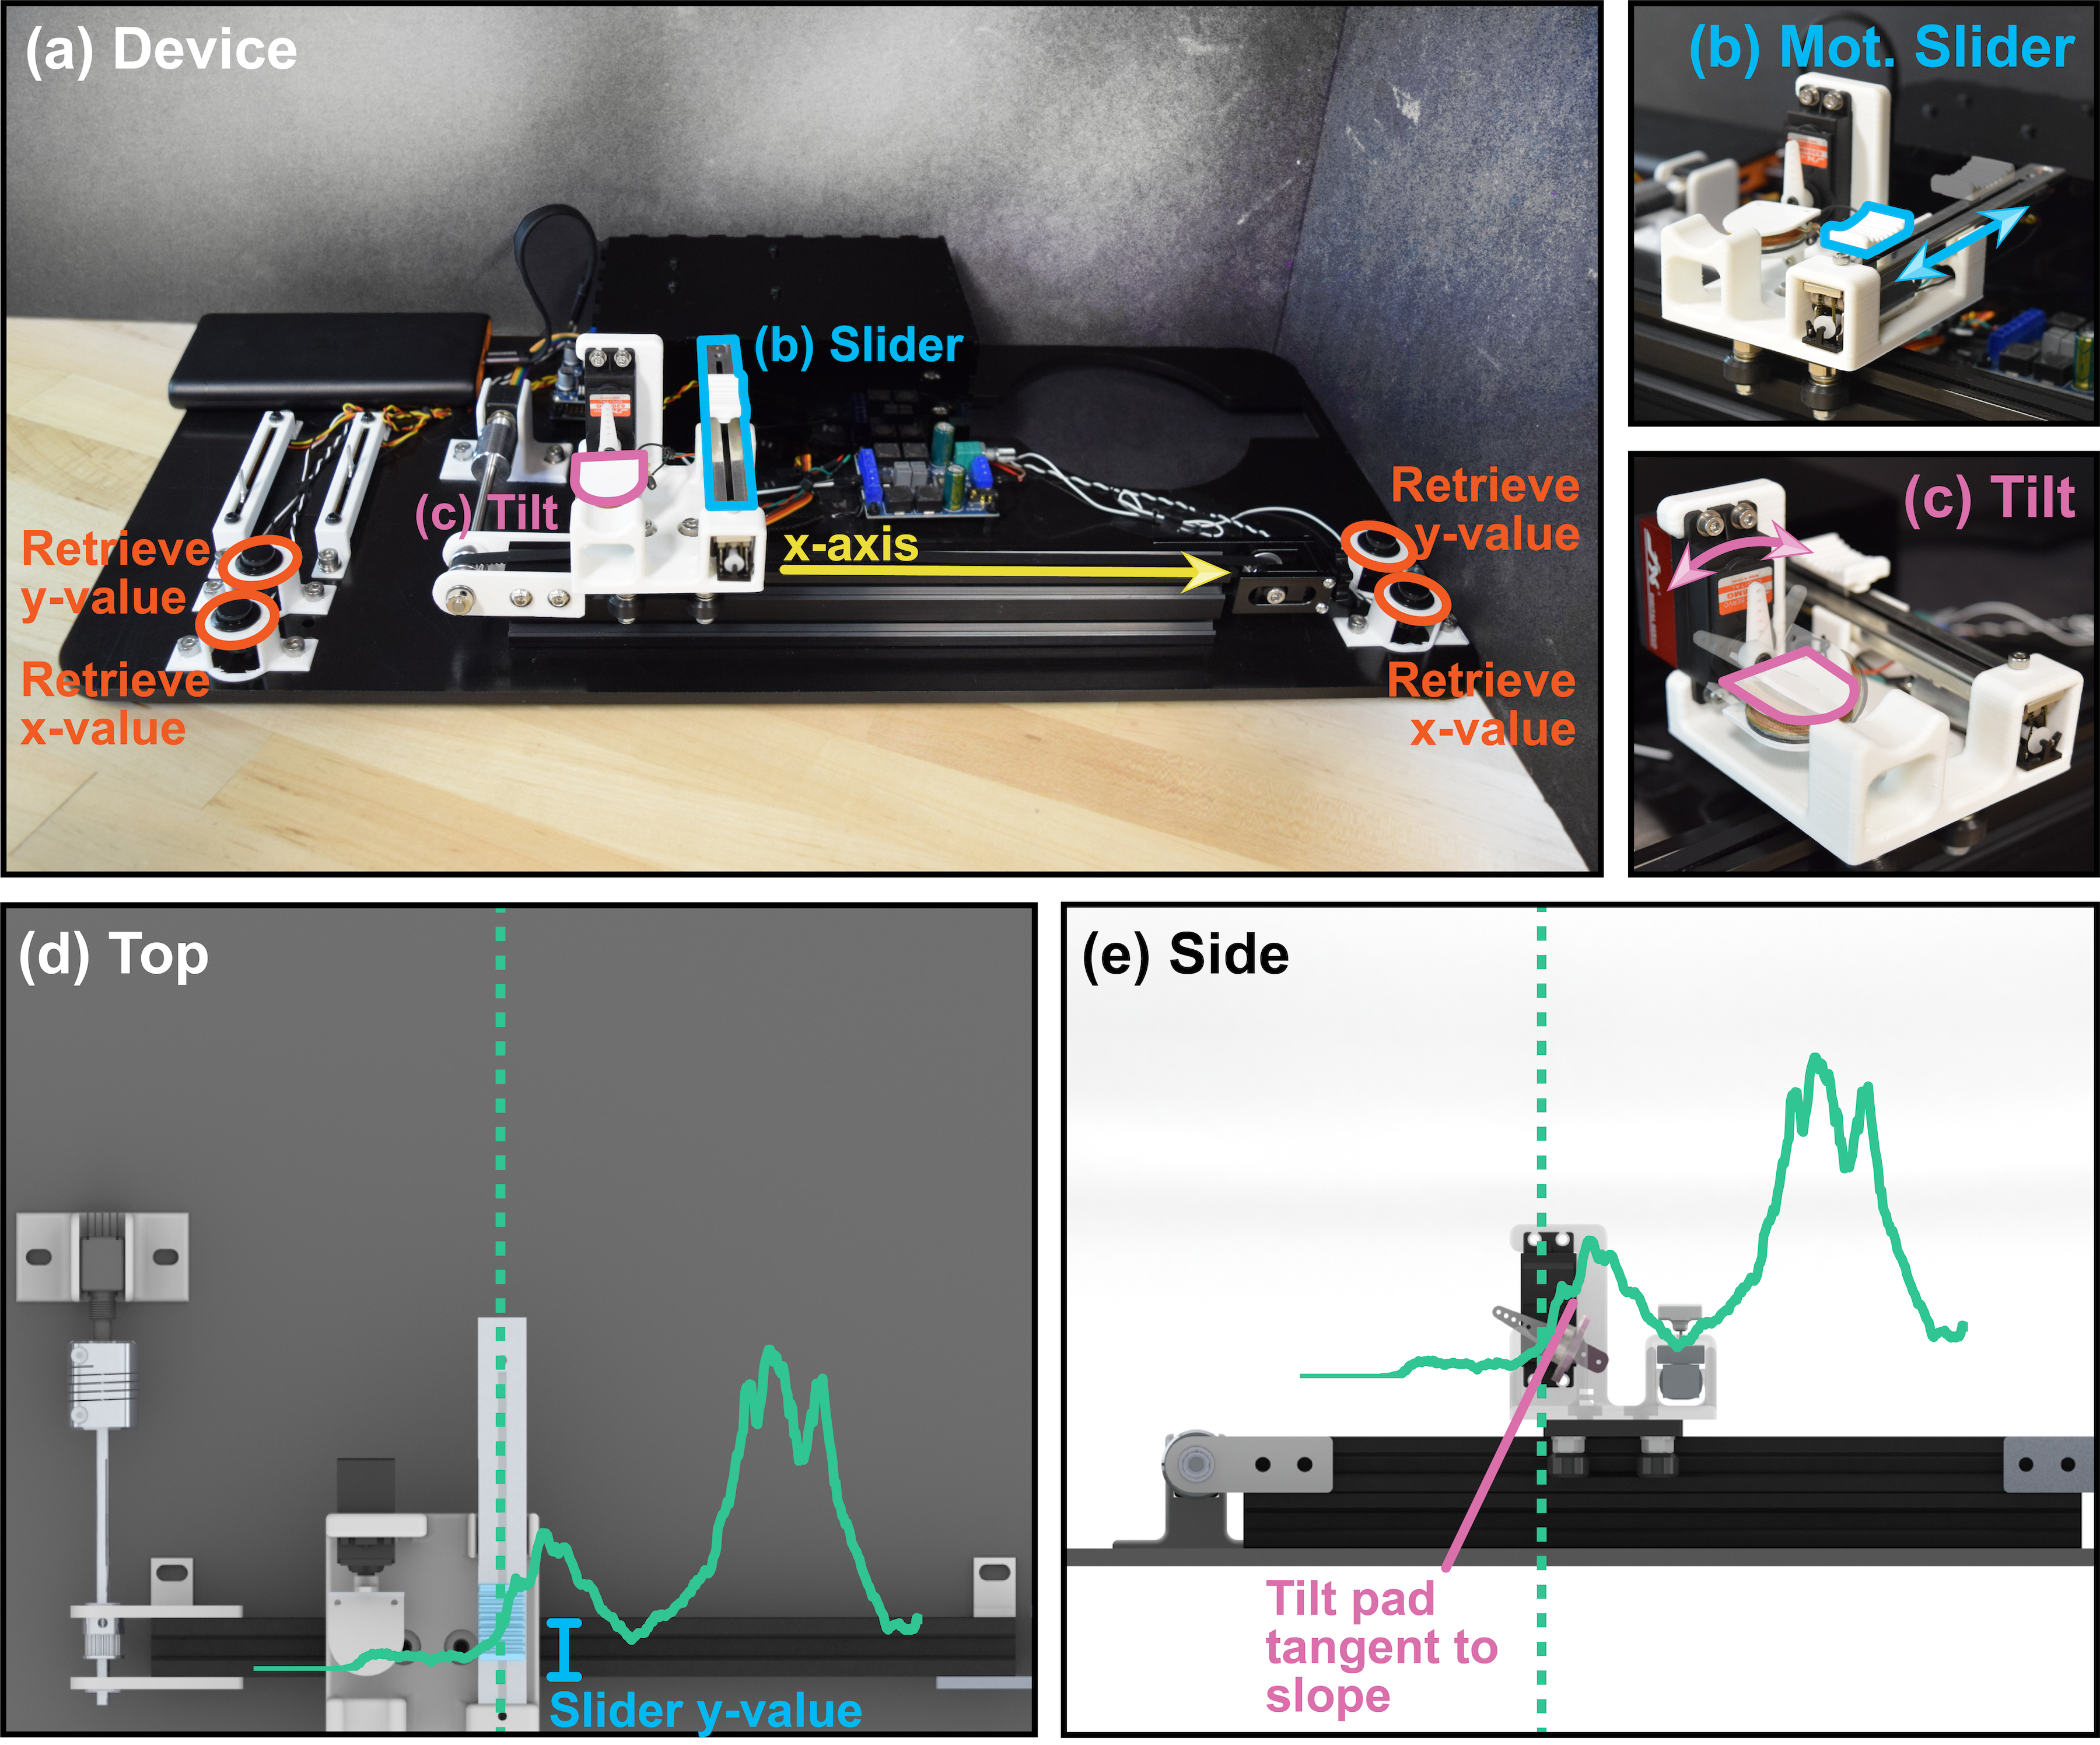
Users slide a platform along a rail to actively explore line graphs (a). In Slide-tone, a sliding platform (b) provides position feedback of the trend’s height (d) to the user’s finger. In Tilt-tone, a tilting platform (c) provides inclination feedback of the trend’s local tangent (e) to the user’s finger. Both systems provide sonification and x-value, andy-value retrieval through speech output.